
Activities
Monitoring the North Sea and the Baltic Sea
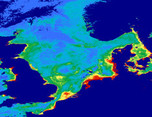
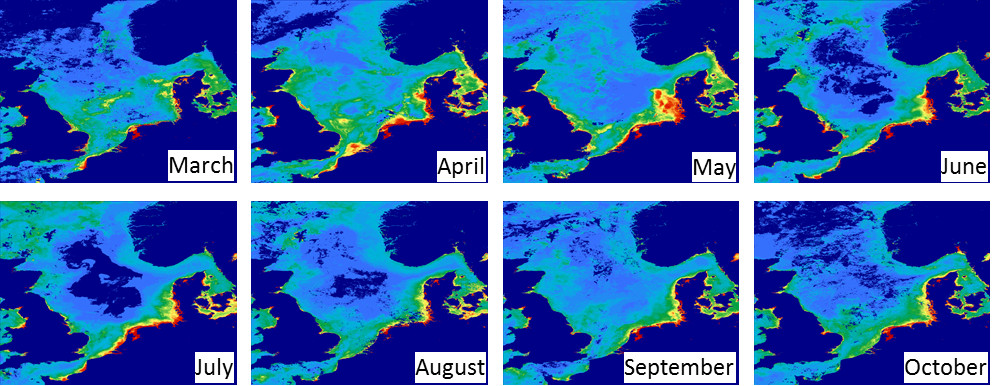
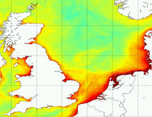
BSH, the German Federal Hydrographic Agency, is obliged to constantly assess the state of the North Sea and Baltic Sea, and to give reports about the state for defined observation periods. This is achieved by yearly monitoring cruises covering the whole North Sea and several cruises covering the area of the German Bight. Additional data are provided by 9 fixed stations of the marine monitoring network MARNET. MARNET data are transmitted every hour directly to BSH. A focus of BSH activities is the interaction of the North Sea with the North Atlantic at the open northern boundary of the North Sea – also with regard to climate change. Here the near-surface patterns (currently provided using MODIS data) of horizontal chlorophyll, Total Suspended Matter (TSM), and Coloured Dissolved Organic Matter (CDOM) distributions give valuable hints on exchange mechanisms and local dynamics. Temporal averages from chlorophyll concentration derived from satellite data allow to monitor the spatial distribution of phytoplankton evolution during the growing season (Figure 1).
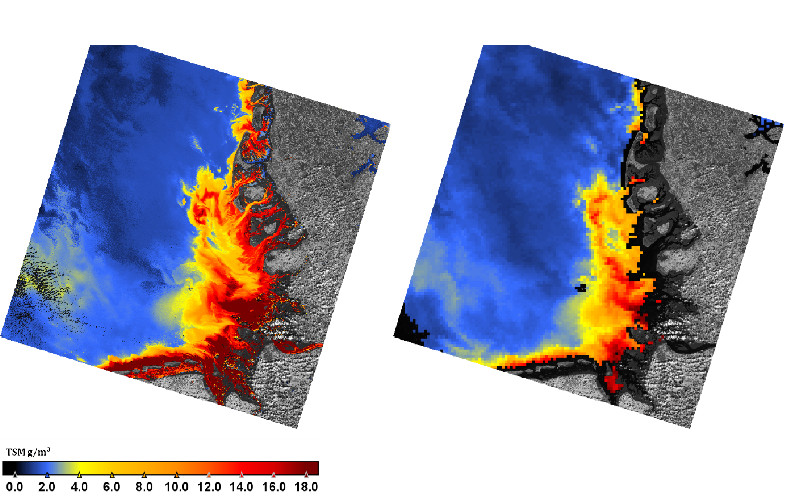
Higher resolution data provided during the HighRoc project will greatly enhance the evaluation and provide a better understanding of patterns, in particular in the Wadden Sea inlets, big estuaries and river plumes. The image pair below shows the TSM concentration derived from 30m- Landsat OLI sensor and from 1 km MODIS sensor, which have been acquired within 1 hour difference (19.04.2014).
BSH is also responsible for approving offshore wind farm development projects in the German North Sea and Baltic Sea. It carries out the application procedure for wind farms in the German Exclusive Economic Zone (EEZ). BSH reviews whether marine environmental features need protecting (e.g. birds, fish, marine mammals, benthos, sea bottom and water) or are put at risk by the project. One objective of HighRoc is to investigate the influence of such constructions and if they can be evaluated with TSM or turbidity mapping around the existing wind parks.
Monitoring of the eutrophication state of the North Sea from space
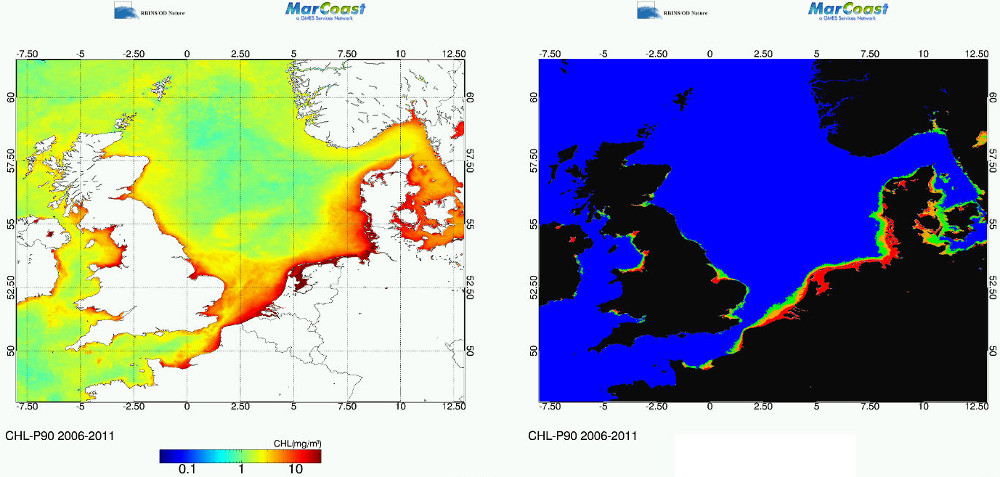
The Marine Strategy Framework Directive (MSFD) is currently the main driver for monitoring the coastal and offshore waters in Europe. It is one of the most important legal instruments of the European Commission to protect the marine environment including its ecosystems and biodiversity. It aims to achieve good environmental status of the EU's marine waters by 2020. Human-induced eutrophication is one of the criteria being assessed. It is defined as the (anthropogenic) enrichment of water by nutrients causing an accelerated growth of algae and higher forms of plant life to produce an undesirable disturbance to the balance of organisms present in the water and to the quality of the water concerned.
Eutrophication monitoring via chlorophyll-a (CHL) concentration. More specifically, the main indicator is the chlorophyll-a 90 percentile (CHL-P90) over the phytoplankton growing season (i.e. March – November incl.) for a period of six years expressed in µg/l or mg/m³ (Figure 1). The CHL-P90 is the CHL concentration below which 90 percent of observations fall. While in situ data acquisition is still considered as the main monitoring tool there is a growing tendency to use optical remote sensing as a supporting tool to achieve the monitoring requirements because of severe resource constraints of available ship time and manpower.
HIGHROC will build on previous work, for example in the MARCOAST project, to improve existing services for eutrophication monitoring by enhancing the temporal resolution (frequency) of data and the spatial resolution, giving better information close to the coast and within estuaries.
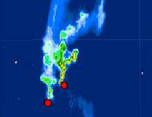
Oyster-farming management: the GIGASSAT project
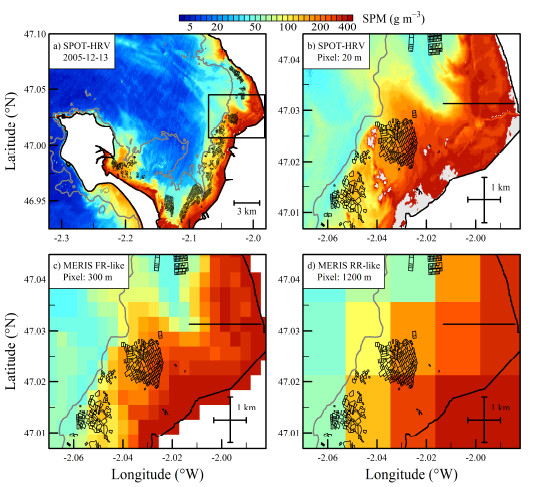
SPM variations influence the physiological responses of suspension-feeders such as oysters, mussels and other filter-feeders. High concentrations of suspended particulate matter (SPM) negatively affect the ability of oysters to filter seawater, select and ingest particles. Oyster clearance rate stops above a concentration threshold of about 200 g m-3 as a result of gill saturation, and particle selection efficiency, which allows oyster to preferentially select organic particulate organic matter before ingestion, decreases when SPM exceeds 150 g m-3. Satellite-derived SPM maps could be used in aquaculture management and spatial planning to identify farming sites with the most favorable SPM conditions for oyster growth. The development of SPM algorithms specifically adapted to turbid waters to support aquaculture is all the more needed than oyster-farming sites are often located within muddy intertidal environments characterized by high SPM values and a large range of variability in the concentration and composition of marine particles.
The HIGHROC project will contribute to the development of ocean color remote sensing algorithms to map SPM and phytoplankton concentrations in turbid coastal waters characterized by large intertidal zones. The routine application of these algorithms to high spatial (30 m) and high temporal (15 mmn) satellite observations will allow improving the management of oyster-farming ecosystems.
These satellite products will also complement the ongoing activities performed in the frame of the GIGASSAT research project (www.gigassat.org) which aims at assessing the impact of climate change on oyster growth, health and farming (project funded by the French Research National Agency (ANR-12-AGRO-0001, Principal Investigator: Fabrice Pernet, IFREMER).
References
Barillé, L., Prou, J., Héral, M., & Razet, D. (1997). Effects of high natural seston concentration on the feeding, selection and absorption of the oyster Crassostrea gigas. Journal of Experimental. Marine Biology and Ecology, 212, 149 – 172.
Gernez P., Barillé L., Lerouxel A., Mazeran C., Lucas A. and D. Doxaran (2014). Remote sensing of suspended particulate matter in turbid oyster-farming ecosystem. Journal of Geophysical Research - Oceans, accepted.
Looking at dredging activities using remote sensing
Dredging activities may lead to various adverse impacts on the marine environment, especially when carried out near sensitive habitats such as coral reefs or sea grass beds. Moreover, dredging activities potentially affect not only the site itself, but also surrounding areas (by e.g. turbid plumes, sedimentation, re-suspension, release of contaminants, and bathymetric changes). Therefore, dredging operations are subjected to strong environmental regulations, one of which requires that the sediment dynamics are monitored, temporally as well as spatially, in an ever increasing manner.
Sentinel-2 can provide TSM concentration maps and RGB maps for the dredging site at high spatial resolution to monitor the background concentrations and sediment plumes generated during dredging. These data can complement current in situ monitoring and can be used as calibration/validation of sediment transport models.
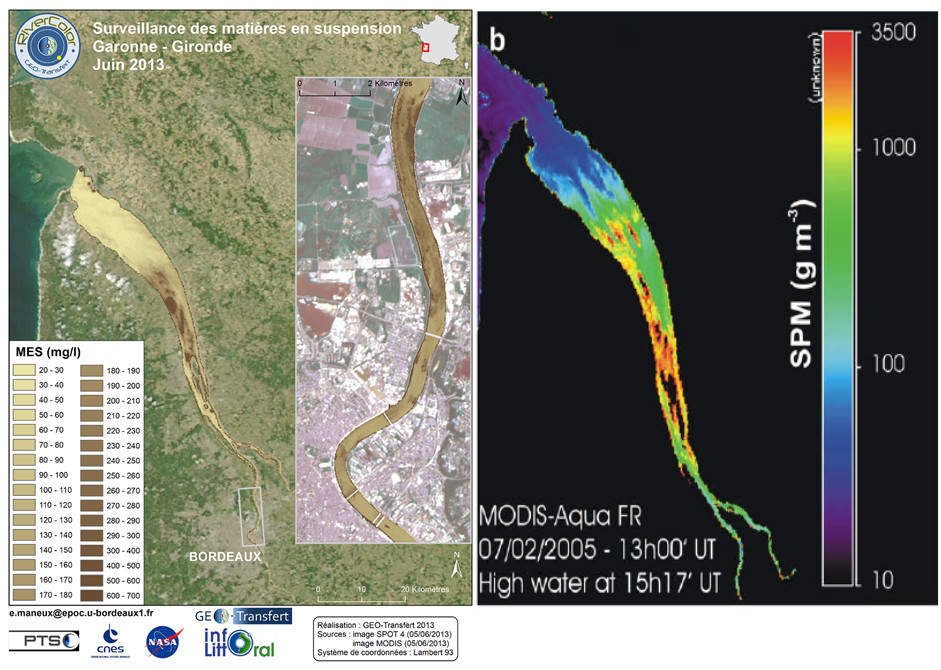
Dredging activities in a macro-tidal estuary: the Gironde (SW France)
The Garonne and Dordogne deliver a large amount of suspended particulate matter (SPM) into the macro-tidal Gironde estuary (SW France). Because of the residual tidal circulation in the estuary, the trapping of sediments forms a maximum turbidity zone (MTZ) where fluid mud develops during neap tides resulting in the filling of the main navigation channels.
Management of sediment transport and navigation in the estuary therefore requires costly daily dredging activities which would benefit from the monitoring of SPM concentrations in the estuary and also in its plume.
Dredging activities would greatly benefit from daily mapping of SPM concentrations in the estuary at adapted spatial scales (from 30 m inside the estuary (Doxaran et al. 2002, 2009) to several kilometers in the river plume which develops in the Bay of Biscay). These maps will be generated as part of the HIGHROC project and the satellite-derived SPM product will be provided to users (the GEO-Tranfert unit and the Port of Bordeaux) with its associated uncertainty. An optimal fusion of multi-sources ocean colour satellite data will be developed for users.
In order to optimize the efforts of the remote sensing community, a collaboration is engaged between the HIGHROC research project and the RIVERCOLOR project (P.I. Virginie Lafon, GEO-Tranfert unit) funded by the French Space Agency (CNES-TOSCA): www.geotransfert.epoc.u-bordeaux1.fr/rivercolor), that aims at producing turbidity algorithms to retrieve SPM from high and low resolution optic sensors.
References
Doxaran, D., Froidefond, J.M., Lavender,S.J. and Castaing, P. (2002). Spectral signature of highly turbid waters. Application with SPOT data to quantify suspended particulate matter concentrations. Remote Sensing of Environment, 81, 149-161.
Doxaran D., J.M. Froidefond, P. Castaing and M. Babin (2009). Dynamics of the turbidity maximum zone in a macrotidal estuary (the Gironde, France): Observations from field and MODIS satellite data. Estuarine, Coastal and Shelf Science 81, 321–332.
Lafon, V., Robinet, A., Donnay, T., Doxaran, D., Lubac, B., Maneux, E., Sottolichio, A., Hagolle, O., 2014. RIVERCOLOR : chaîne de traitement des séries temporelles LANDSAT, SPOT et MODIS dédiée à la cartographie des matières en suspension en zone estuarienne. XIIIèmes JNGCGC, Dunkerque (France), 2-4 July 2014, accepted.
Marine Remote Sensing in Norway
Through the Directive 2000/60/EC of the European and of the Council of 23 October 2000 establishing a framework for the Community action in the field of water policy, or also known as the EU Water Framework Directive (WFD), Norway is obliged to manage the water resource with the same principles as the other EU-countries. The implementation of the Water Directive in Norway is based on Vannforskriften (“Law of Water”).
In early 2014 a new guideline was published by the Norwegian Environment Agency (Veileder 02:2013), with further developments compared to the first version. The main principle for the classification system is that the ecological state should be based on the biological quality elements such as chlorophyll-a, whiles the physical and chemical conditions, such as nutrients and Secchi disc depth, are support parameters.
In Norway there are different service providers that perform monitoring programs in the different regions. Common for all is that the water quality should be classified by the last updated guideline published by the Norwegian Environment Agency. In the last guideline, a very high frequency of sampling of chlorophyll a is required for the classification to make sure that the seasonal variation of the chlorophyll concentration is captured. As an example, for the southern Norway (south of Stadt), the sampling should be from February to the beginning of October with a sampling interval of every 14 day in February and March, and monthly otherwise. The classification should be based on the 90 percentile from minimum three years of data (recommended six years).
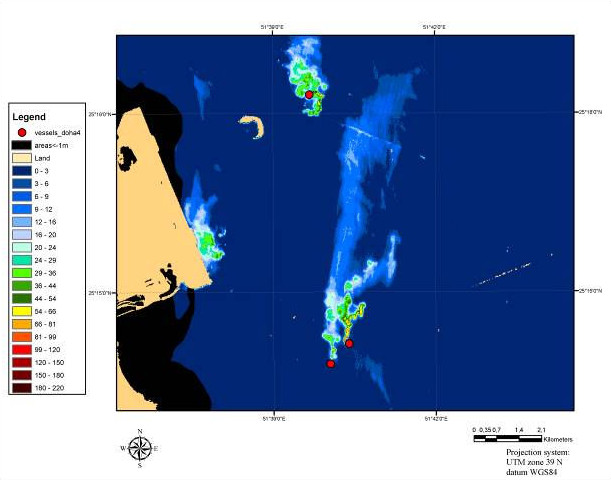
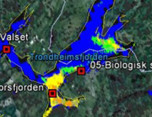
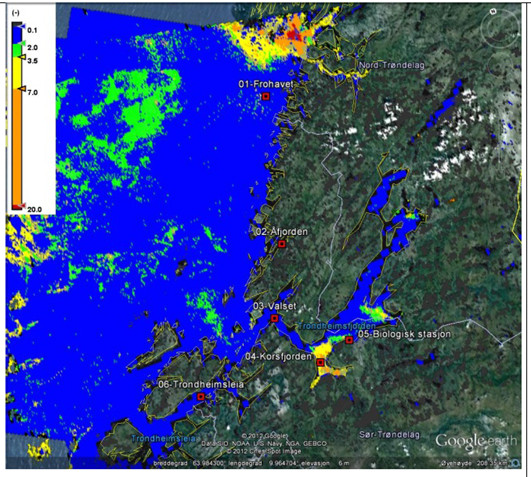
For Norway, all coastal areas along the Norwegian coast are of interest (where coastal area is defined as within the 1 nautical mile from the baseline ), and below is an example from a monitoring program from Trondheimsfjorden 2011, Norway (Pedersen et al., 2012). In Figure 1, a monthly average of chlorophyll a from June 2011 from satellite data (MERIS on Envisat) is presented with the same colour classification as in an earlier national guideline (SFT 97:03).
References
Pedersen, A., Borgersen, G., Folkestad, A., Johnsen, T. M., Norling, K. and Sørensen, K., 2012. Surveillance Monitoring in coastal waters-Trøndelag. Preliminary results for 2011. NIVA-report, 6415-2012, 139 p.
Veileder 02:2013. Klassifisering av miljøtilstand I vann. Økologisk og kjemisk klassifiseringssystem for kystvann, grunnvann, innsjøer og elver.
Veiledning 97:03. Classification of environmental quality in fjords and coastal waters. A guide. TA-1467/1997. 36 p.